 DGLink
While portals supporting user-submitted biomedical data hold substantial scientific value, the re-use of this data at scale is limited by a lack of standardization and annotation. DGLink addresses this gap by automatically assembling portal content into a knowledge graph linking data within a portal and mapping it to external knowledge. This knowledge graph creates a shared interoperability layer that enables knowledge-driven data interpretation and cross-portal discovery. Crucially, the DGLink system not only aggregates existing metadata for projects but also automatically parses and annotates experimental data files directly, greatly increasing annotation depth. For more information on the system please feel free to read the abstract of our talk recently presented at ISMB 2026 or take a look at our GitHub repository.
This page provides access to a DGLink-constructed knowledge graph combining content from multiple National Cancer Institute Cancer Research Data Commons (NCI-CRDC) data portals, namely:
Additionally, we provide summary statistics for the merged NCI-CRDC knowledge graph and example applications including a structured semantic interface. Finally, we explore how DGLink can integrate into an agentic workflow via an MCP-based knowledge-graph server, providing both example MCP queries and benchmarking MCP performance.
DGLink extracts from the data files a portal makes downloadable, so how much of each portal was processed differs. The General Commons was covered in full at the open-access level; the Genomic and Proteomic Data Commons each only had a few cases/studies processed as a proof of concept.
Every open-access study in the NCI General Commons was processed end to end — DGLink extracted content from all of their data files. Controlled-access studies appear as metadata only.
A proof-of-concept subset of studies and cases was processed to demonstrate genomic coverage — not the entire commons.
A proof-of-concept subset of studies and cases was processed to demonstrate proteomic coverage — not the entire commons.
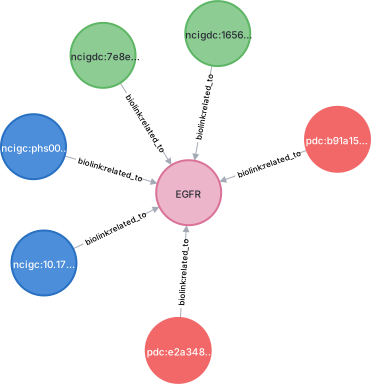
EGFR — a single gene node — linked to studies and cases drawn from all three CRDC portals. This triangulation across data modalities is exactly what DGLink's merge produces, and what no single portal can show on its own.
| Entity type | GC | GDC | PDC | Total | Cross-portal | Share of all nodes |
|---|---|---|---|---|---|---|
| Case | 1,366 | 50,270 | 6,640 | 58,276 | – |
56.5%
|
| Gene | 2,862 | 32,048 | 23,700 | 32,476 | 23,386 |
31.5%
|
| RNAProduct | 11 | 7,044 | 4,043 | 7,699 | 3,390 |
7.5%
|
| SmallMolecule | 405 | 20 | 2,074 | 2,378 | 118 |
2.3%
|
| Disease | 167 | 299 | 170 | 545 | 76 |
0.5%
|
| Study | 64 | 91 | 288 | 443 | – |
0.4%
|
| Publication | 310 | – | – | 310 | – |
0.3%
|
| NamedThing | 160 | 14 | 158 | 288 | 39 |
0.3%
|
| MacromolecularComplex | 80 | 22 | 90 | 148 | 39 |
0.1%
|
| OrganismTaxon | 22 | – | 122 | 139 | 5 |
0.1%
|
| GrossAnatomicalStructure | 75 | 66 | 48 | 138 | 38 |
0.1%
|
| BiologicalProcess | 68 | 2 | 44 | 103 | 10 |
0.1%
|
| StudyPopulation | 89 | – | – | 89 | – |
0.1%
|
| Agent | 50 | – | – | 50 | – |
0.0%
|
| Protein | 9 | 8 | 12 | 21 | 8 |
0.0%
|
| CellularComponent | 10 | 1 | 7 | 17 | 1 |
0.0%
|
Portal columns count a node once for each portal it belongs to, so cross-portal entities add to more than one — Cross-portal is how many nodes of that type are shared across two or more portals.
| Relationship type | GC | GDC | PDC | Total | Share of all edges |
|---|---|---|---|---|---|
| related_to | 4,083 | 397,679 | 336,600 | 738,362 |
84.9%
|
| has_part | 1,510 | 50,270 | 19,465 | 71,245 |
8.2%
|
| associated_with | 1,375 | 51,406 | 7,149 | 59,930 |
6.9%
|
| mentions | 310 | – | – | 310 |
0.0%
|
| contributes_to | 50 | – | – | 50 |
0.0%
|
Nodes are counted once per portal they appear in, so cross-portal entities (e.g. a shared gene) contribute to more than one column — that overlap is exactly what merging the portals produces.
Every node and edge records the portal(s) it came from. When DGLink recognizes that an entity seen in different portals is the same real-world thing, it collapses them into one node whose portal list keeps every origin. Those shared nodes are the bridges that make cross-portal questions answerable.
Each row is a set of portals a node belongs to; rows spanning more than one portal are the cross-portal bridges. Extracted = content DGLink pulled from the data files; metadata = what the portals already expose.
| Portal membership | Extracted | Metadata | Total | Split (% extracted) |
|---|---|---|---|---|
| GDC | 12,443 | 50,573 | 63,016 |
19.7%
|
| GDC + PDCbridge | 24,019 | 4 | 24,023 |
100.0%
|
| PDC | 3,390 | 6,943 | 10,333 |
32.8%
|
| GC + GDC + PDCbridge | 2,799 | 0 | 2,799 |
100.0%
|
| GC | 779 | 1,882 | 2,661 |
29.3%
|
| GC + PDCbridge | 241 | 0 | 241 |
100.0%
|
| GC + GDCbridge | 45 | 2 | 47 |
95.7%
|
| All portals | 43,716 | 59,404 | 103,120 |
42.4%
|
The bridge rows are almost entirely extracted content — cross-portal links come from what DGLink mined out of the data files, not from portal-exposed metadata.
Prefer to write Cypher and see rendered subgraphs? The full knowledge graph is served by Neo4j Browser. Authentication is disabled for this deployment, so no login is required just enter bolt+s://dglink.indra.bio:7676 in the connection URL box and click Connect.
Open Neo4j Browser ↗Paste this to render the cross-portal gene set:
// EGFR linked to the first 2 studies/cases from each CRDC portal (GC + GDC + PDC)
MATCH (a)-[r:`biolink:related_to`]->(g:`biolink:Gene` {name: 'EGFR'})
WITH a, g, r, a.portal[0] AS portal
WITH portal, collect(r)[0..2] AS rels
UNWIND rels AS r
RETURN startNode(r) AS a, r, endNode(r) AS g
The DGLink Model Context Protocol (MCP) server lets you put a question to the merged CRDC knowledge graph in plain English. It gives LLM agents direct access to the graph, so a single question can reason across the GDC, GC, and PDC — with no Cypher to write.
mcp-neo4j-cypher server.Click a question to read the agent’s response. Connect your own LLM to the MCP server (below) to run them yourself.
claude-sonnet-5 · 7 agent turns · 1,058 output tokens · 30.4 s · $0.19
claude-sonnet-5 · 8 agent turns · 3,591 output tokens · 59.3 s · $0.28
claude-sonnet-5 · 11 agent turns · 4,866 output tokens · 88.4 s · $0.38
claude-sonnet-5 · 11 agent turns · 2,019 output tokens · 45.5 s · $0.13
claude-sonnet-5 · 8 agent turns · 2,781 output tokens · 54.6 s · $0.28
claude-sonnet-5 · 9 agent turns · 4,002 output tokens · 60.2 s · $0.33
claude-sonnet-5 · 8 agent turns · 2,904 output tokens · 55.9 s · $0.20
DGLink serves the merged graph over a streamable-HTTP MCP endpoint, so
any MCP-capable client — Claude Desktop,
Claude Code, Cursor, or a custom agent — can connect with just a URL. No
authentication is required, and there is nothing to install locally: no uv,
no Python, no Neo4j driver.
For example, to add it to Claude Desktop, merge the following into claude_desktop_config.json:
{
  "mcpServers": {
    "dglink-crdc": {
      "url": "https://dglink.indra.bio/crdc/mcp/"
    }
  }
}
Or from the command line with Claude Code:
claude mcp add --transport http dglink-crdc https://dglink.indra.bio/crdc/mcp/
Your client then gets tools to inspect the graph schema and run read Cypher against
it. The endpoint is read-only, so queries can explore the graph but never modify it.
Older clients without native remote-MCP support can bridge to the same URL with
npx mcp-remote https://dglink.indra.bio/crdc/mcp/.
One immediate follow-up question to this type of approach might be, “Is the knowledge graph actually necessary, or could a state-of-the-art LLM get the same result if just given access to a portal’s API?” We can test exactly this by giving the same agent the same question twice: once with only API access, and once with access to the knowledge graph. Everything else is held constant — same model, system prompt, and turn budget — so the only variable is the MCP toolset.
All trials were run using Claude Sonnet 5 headless via
claude -p, with the built-in file and shell tools disabled so an agent’s
only capability is its own MCP server.
Both agents can reach the same files — the comparison is pre-indexed graph vs. search-at-query-time, not “can read files” vs. “can’t”.
“Is the gene TP53 present in all three CRDC portals in the ingested data — a GDC case, a GC (General Commons) study, and a PDC proteomic study? Name the specific study/case in each portal.”
Confirmed TP53 in GDC and PDC, but could not verify the GC link — no gene-level field exists in the GC metadata API.
One merged gene node named the specific GDC case, GC study and PDC study in a single traversal.
| Metric | Raw-API agent | DGLink KG agent | Relative | DGLink advantage |
|---|---|---|---|---|
| Agent turns | 26 | 7 | 3.7× fewer | |
| Output tokens | 11,739 | 1,573 | 7.5× fewer | |
| Wall time | 169.6 s | 31.1 s | 5.5× faster | |
| Cost (USD) | $0.63 | $0.17 | 3.7× cheaper |
“Which cancer genes appear in BOTH the caNanoLab (GC) study data files AND a PDC proteomic study? List a few shared genes.”
Limited to text search over file names, it could only spot-check a handful of gene symbols — not compute the intersection.
Computed the full overlap — 2,586 of 2,652 caNanoLab-linked genes also appear in a PDC study — as one graph traversal.
| Metric | Raw-API agent | DGLink KG agent | Relative | DGLink advantage |
|---|---|---|---|---|
| Agent turns | 44 | 9 | 4.9× fewer | |
| Output tokens | 11,149 | 2,963 | 3.8× fewer | |
| Wall time | 166.4 s | 48.4 s | 3.4× faster | |
| Cost (USD) | $1.15 | $0.27 | 4.3× cheaper |
“For each gene in this 20-gene panel, determine whether it appears in any data file of the caNanoLab study (NCI General Commons, phs_accession 10.17917).”
Unlike the open-ended queries above, this task is scored automatically against an independent gold standard: 14 of the 20 panel genes are truly present. Neither agent produced a false positive, so the whole difference is in recall — how many of the 14 each one actually found.
Recall 0.29 · F1 0.44. Limited to filename/metadata text search, it cannot see genes buried inside the study’s data tables.
Recall 0.86 · F1 0.92. File-content gene mentions are pre-indexed on the graph, so it reads them straight off the study node.
| Metric | Raw-API agent | DGLink KG agent | Relative | DGLink advantage |
|---|---|---|---|---|
| Precision | 1.00 | 1.00 | tie | |
| Recall | 0.29 | 0.86 | 3.0× higher | |
| F1 | 0.44 | 0.92 | 2.1× higher | |
| Accuracy | 0.50 | 0.90 | 1.8× higher | |
| True positives | 4 / 14 | 12 / 14 | 3.0× more |
Gold-positive: 14/20. KG agent missed IDH1, TP53. Raw-API agent missed BRCA2, IDH1, IGF1R, MAPK3, MTOR, PTEN, RB1, SMAD4, TP53, VHL.
| Metric | Raw-API agent | DGLink KG agent | Relative | DGLink advantage |
|---|---|---|---|---|
| Agent turns | 51 | 12 | 4.3× fewer | |
| Output tokens | 18,575 | 3,575 | 5.2× fewer | |
| Wall time | 222.2 s | 71.3 s | 3.1× faster | |
| Cost (USD) | $1.37 | $0.19 | 7.2× cheaper |